Javascript Stull Charts
Implementations of a SiO2:Al2O3 Stull Chart using various Javascript libraries.
View on Github
Introduction
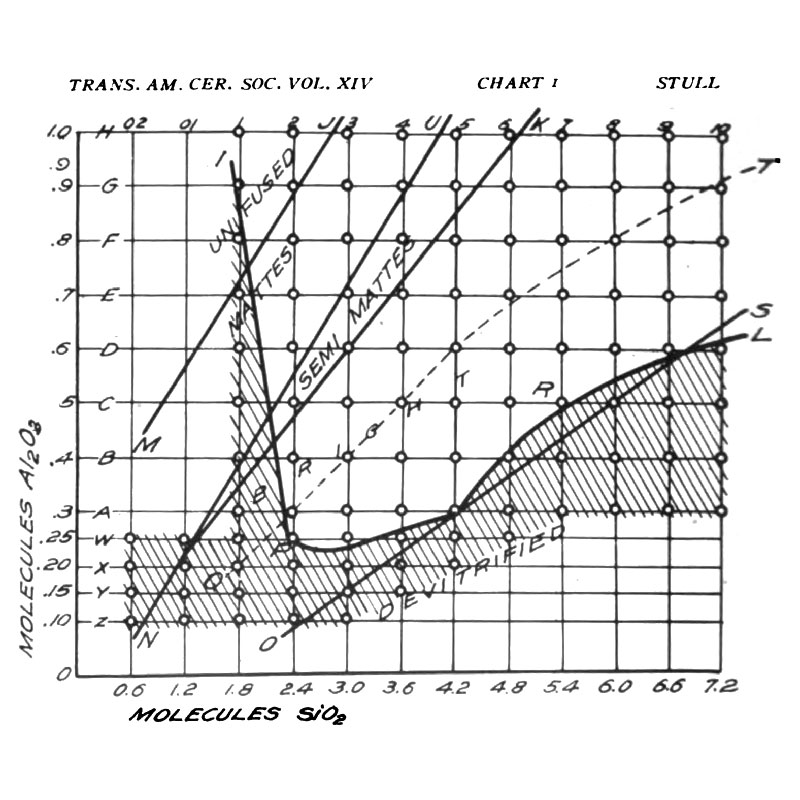
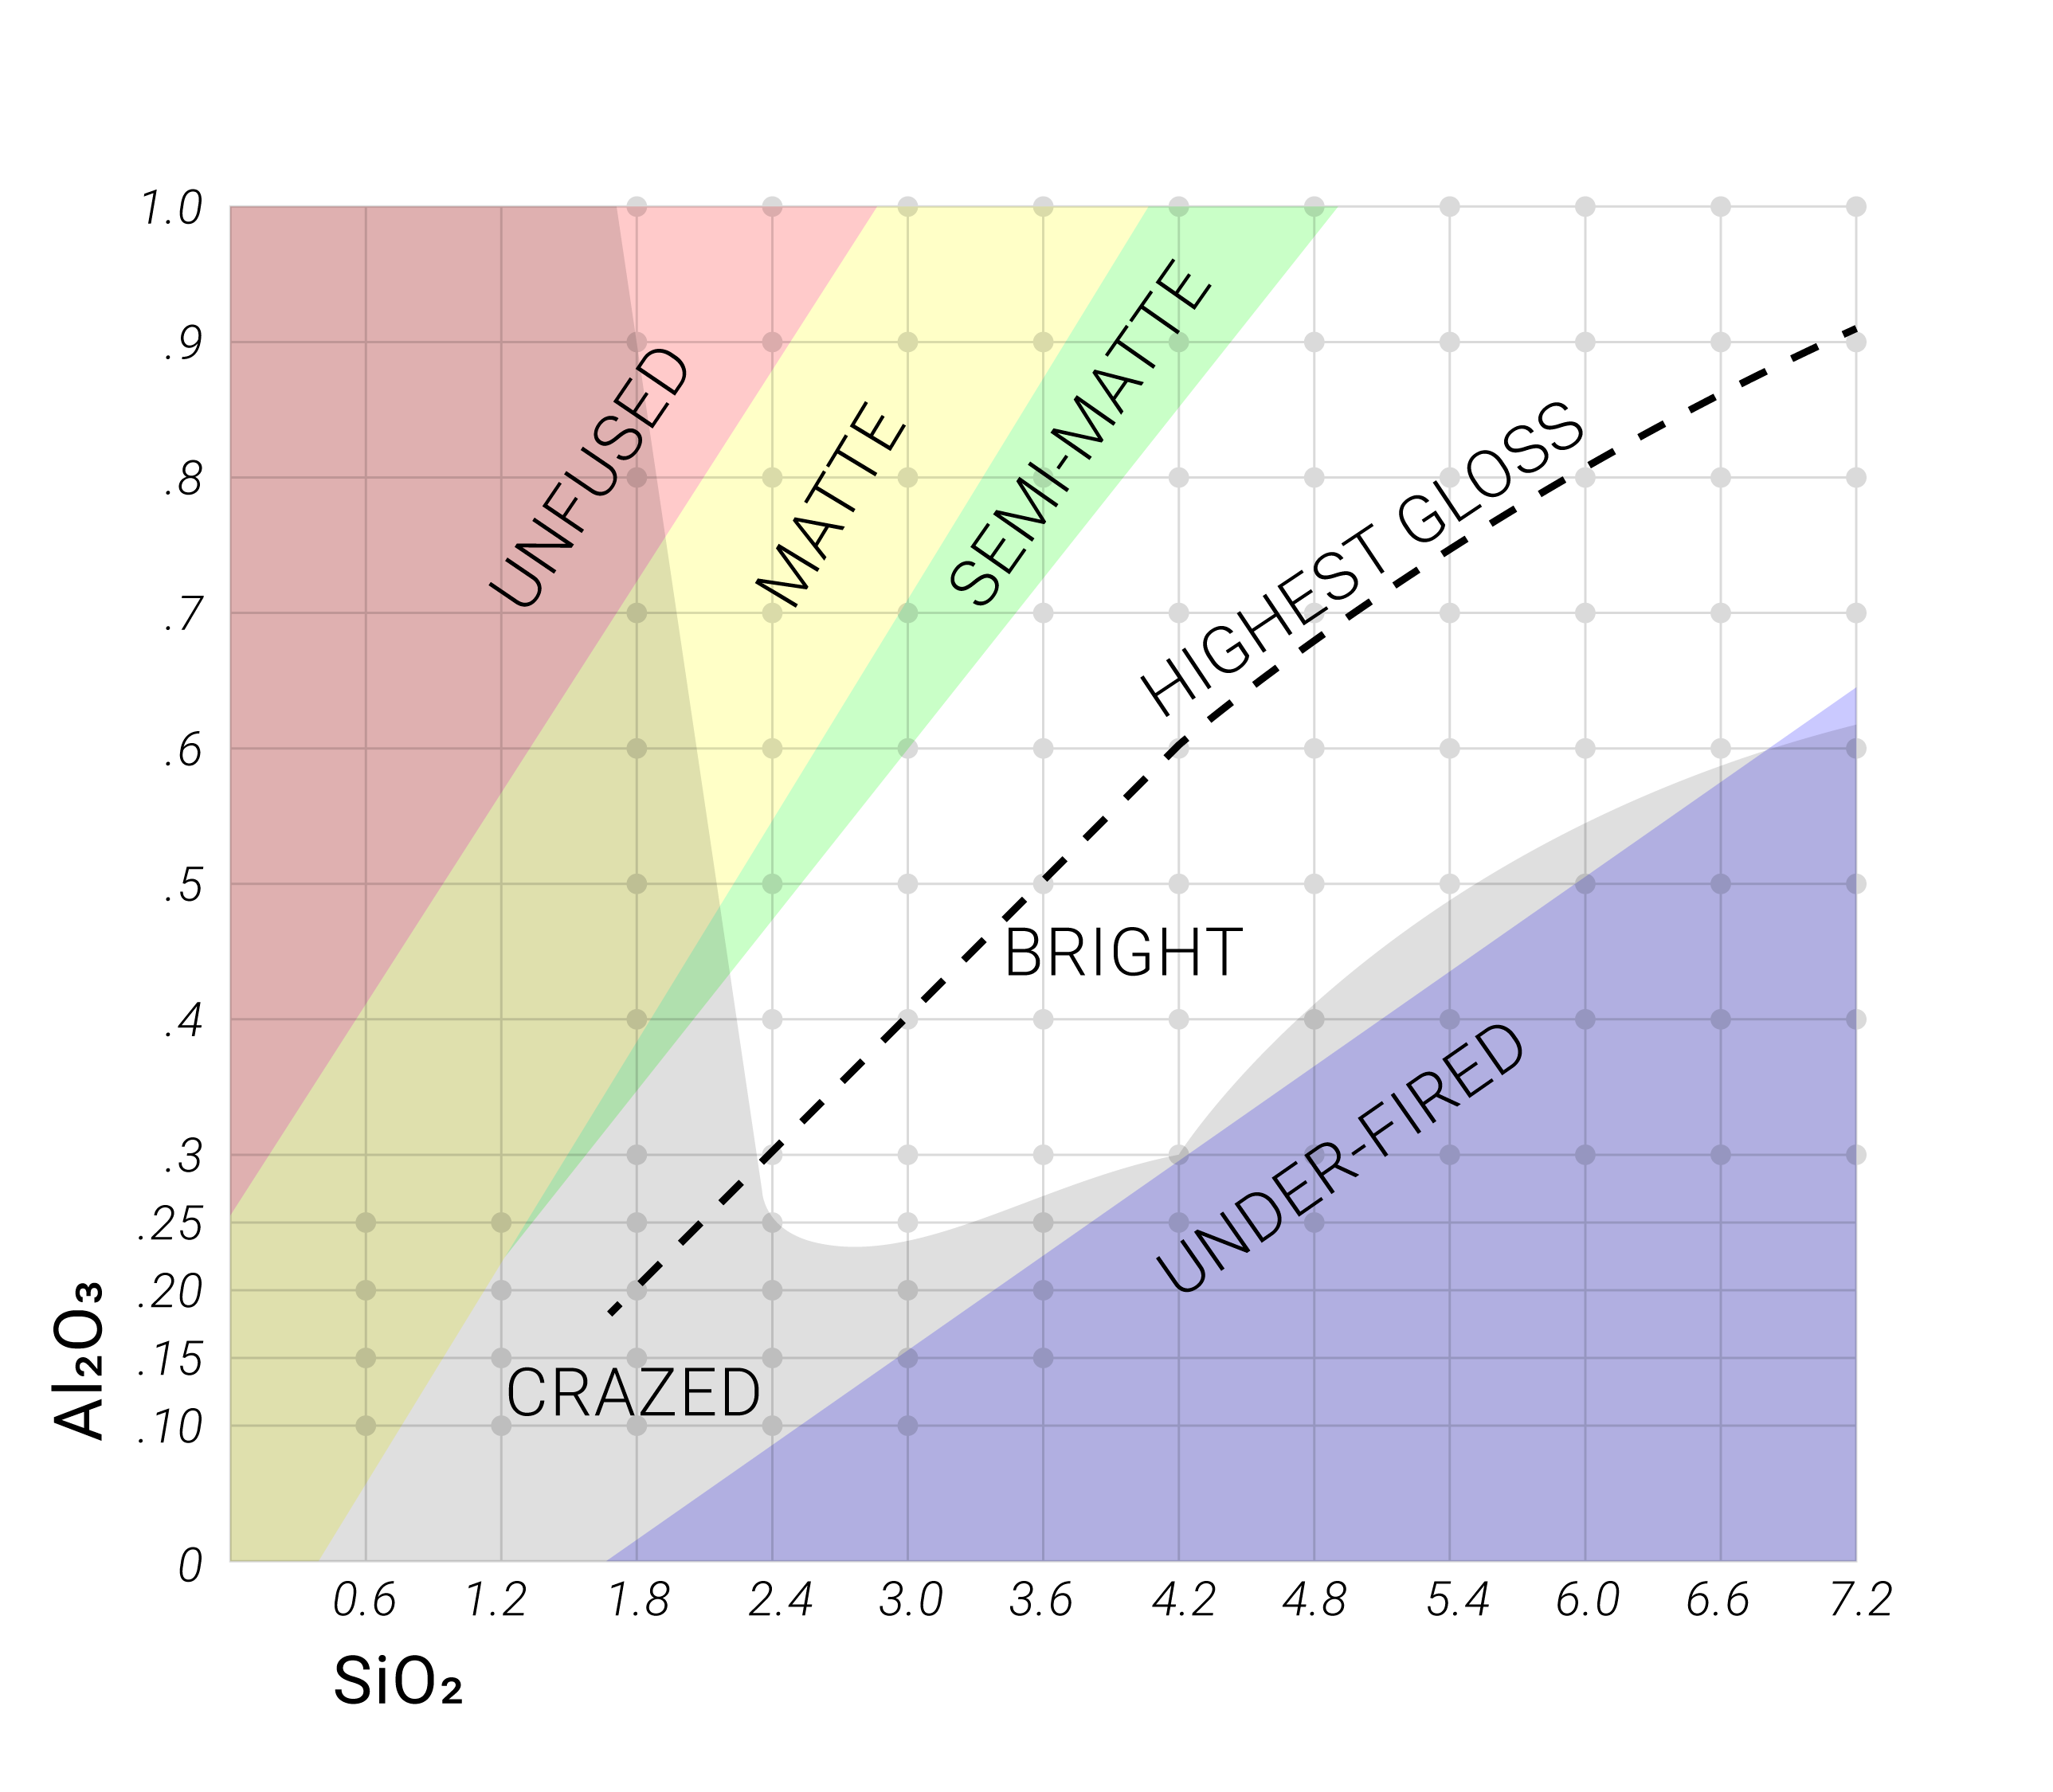
The Glazy Stull Chart overlay was inspired by the original work of R.T. Stull and the continued research of Matt Katz.
For more information, see R.T. Stull's original article in Transactions of the American Ceramic Society, Volume 14, pages 62-70.
Also see Matt Katz's online courses on Ceramic Materials Workshop
Stull & Javascript Charts
The primary difficulty with making Stull Charts in Javascript is combining the bottom "region" layers with an overlapping scatter plot of actual UMF analyses for recipes. Furthermore, each point in the scatter plot contains additional color-coded information (R2O:RO).
d3.js Example
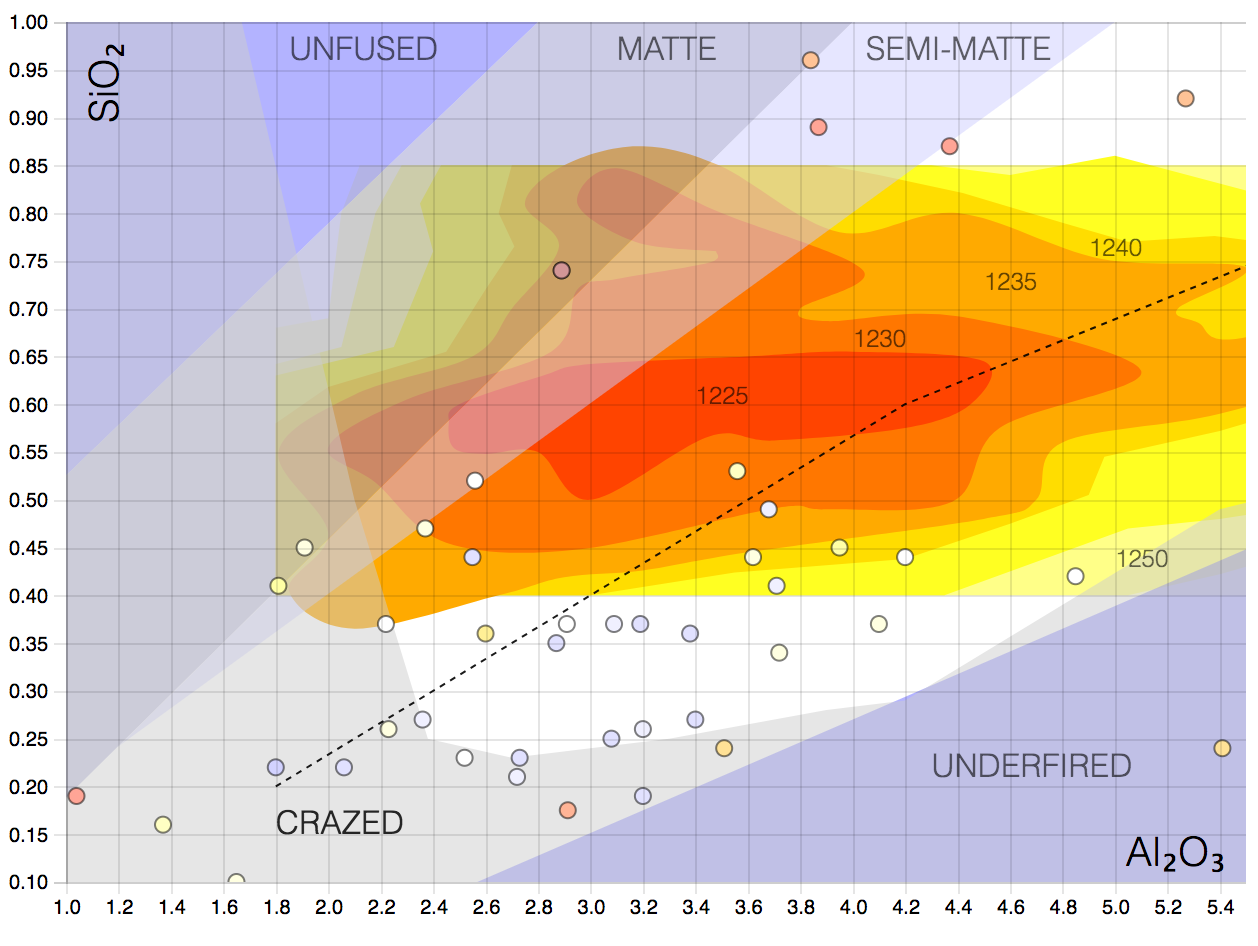
After experimenting with a number of Javascript charting libraries, it seems that d3 is ultimately the best choice due to its ability to draw complex charts with multiple layers. This d3 example uses actual recipe data from an externally loaded JSON file.
Chart.js Example
While having a much simpler interface than d3, Chart.js does allow one to combine a line chart (for drawing the underlying Stull regions) with scatter plot data.
- Hover over point to highlight recipe in list.
- Click on point to see the recipe on Glazy.
Glazy Links
Hover over link with mouse to highlight the recipe on the Stull Chart.
Highcharts Example
This is a static version of the Highcharts implementation on https://glazy.org
Full implementation on Glazy